How can you use Analytics numbers to craft a story? Which data points should you prioritize for analysis? It’s crucial to avoid getting overwhelmed and instead focus on asking the right questions to create a complete picture from your reports.
To effectively leverage your data, it’s essential to pinpoint the most critical analysis points and avoid getting bogged down by the abundance of metrics and dimensions. Additionally, it’s crucial to comprehend how your business realities are reflected in Analytics data.
This post will discuss the 12 key GA4 metrics that form the foundation of a comprehensive data analysis.
What is a metric?
A metric is a quantitative measurement presented as a sum or ratio. In Analytics, metrics provide numerical information about your website, helping you to pinpoint its strengths and weaknesses and identify areas for improvement.
By learning how to read reports based on these metrics, you can take your business to the next level. GA4 offers an abundance of metrics to track, but it’s essential to focus on the most relevant ones.
I’ve compiled a summary of the metrics that can offer valuable insights into your business’s performance:
- Users
- Sessions
- Engagement Rate
- Average Engagement Time
- Views
- Event Count
- Conversions
- Conversion Rate
- Lifetime Value
- Total Revenue
- User Acquisition
- Advertiser Ads Clicks
1. Users
The first metric on our list is Users. GA4’s Users metric is crucial as it helps you comprehend your target audience by showing the total number of unique users who have engaged with your website.
Analyzing this metric provides insights into how your customers are interacting with your website. It can also help determine if your content is engaging enough and if your business is experiencing positive user growth.
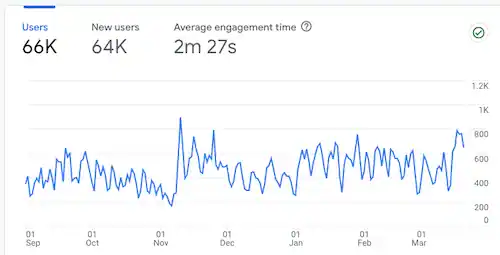
A result-driven question to ask when analyzing this metric is “Is my content attracting more users?”
2. Sessions
Next up is Sessions, a crucial metric that reveals the number of sessions initiated on your website or application.
While the session-scope concept of Universal Analytics is absent in GA4, sessions remain one of the primary metrics in reports. Additionally, GA4 has significantly improved the metric by not starting new sessions if the same user comes from a different traffic source or continues browsing your website at midnight. Consequently, GA4 should provide a more accurate count of your website visitors.
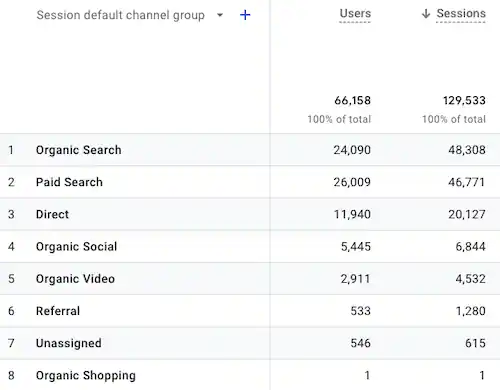
Analyzing the GA4 sessions metric is vital as it helps determine how much traffic is being generated and identify trends in user behavior. A useful question to ask when analyzing this metric is “How can I increase my traffic?”
3. Engagement Rate
The Engagement Rate allows you to determine how your customers are interacting with your website content. It’s essential to understand what an engaged session means in GA4.
A session is considered engaged if it meets one of the following conditions:
- It lasts longer than 10 seconds;
- It results in one or more conversion events;
- It results in two or more page/screen views.
Compared to the UA bounce rate, the new GA4 equivalent provides more accurate information about true interaction with the website, rather than simply indicating that users exited your website.
To calculate the GA4 engagement rate, divide engaged sessions by total sessions. This metric is powerful as it helps you understand your user experience and identify areas for improvement. By analyzing it, you can determine if your content meets the expectations of your users.
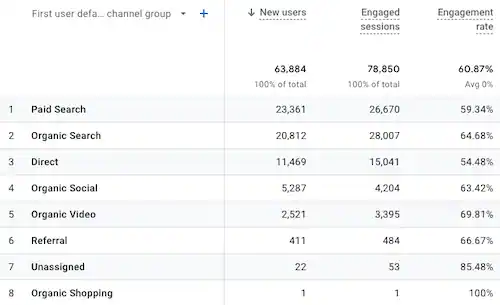
A valuable question to consider when analyzing the GA4 engagement rate is “Do my users find what they are looking for?”. Additionally, you can ask “How can I optimize my content?” These questions can help you identify if your website is meeting the needs of your users and how you can improve their experience.
4. Average Engagement Time Per Session
The Average Engagement Time is a crucial metric that indicates how long your website remains in your user’s focus. GA4 calculates the average engagement time by adding up the duration of user engagement for each active user.
This metric is essential because it can provide valuable insights into your user’s journey on your website. However, the average time may vary depending on the type of business you have, and it is advisable to evaluate it over different time frames.
By analyzing this metric, you can assess various aspects of your website, such as loading speed, error existence, and interface user-friendliness, which significantly impact active user engagement. If you notice a decline in engagement time, it could indicate areas of improvement for your website.
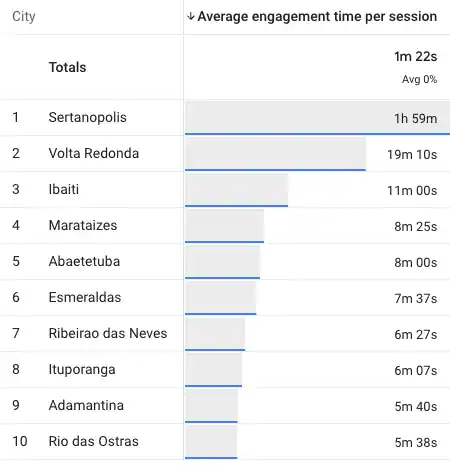
A useful question to ask is “What causes visitors to leave my website earlier?” This can help you identify the potential issues and take actionable steps to improve user engagement.
5. Views
The Views metric is a key engagement metric that indicates how many times a webpage or app screen was viewed by users. Analyzing the GA4 views metric can help you develop an effective SEO strategy and identify how your website is performing, as well as the impact of any changes on user behavior.
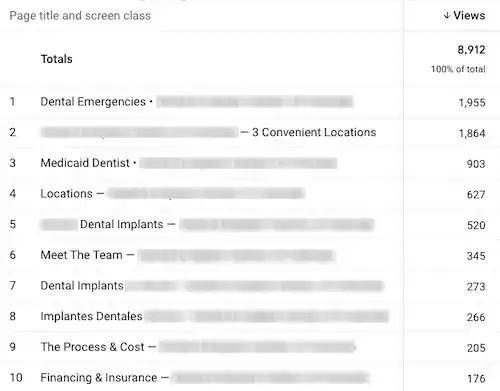
A useful actionable question to ask when analyzing views is “Am I providing a good user experience on my website?”. This question can help you evaluate whether your website is meeting the needs of your users and identify areas where improvements can be made.
6. Event Count
The GA4 event count metric represents the number of times a specific event was triggered by your website users. Analyzing the event count can help you gain a deeper understanding of your user journey and customer behavior.
This valuable insight allows you to better serve your customers and meet their needs. Identifying your top events can provide even more powerful information to help you optimize your website and improve user experience.
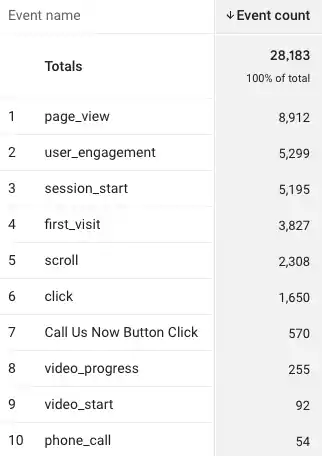
An important question to ask when analyzing event count is “What are my top events?”.
7. Conversions
The GA4 conversions metric reveals the number of users who have completed a desired action on your webpage, such as making a purchase or filling out a form.
Conversion rate is a crucial metric for measuring the success of your online business. By analyzing this metric, you can determine which areas of your webpage need improvement and make data-driven decisions to optimize your user experience.
Furthermore, you can (and should) track changes in your conversion rate over time and assess the effectiveness of your marketing campaigns.
An objective question you should ask yourself here is “What are the primary factors affecting my conversion rate, and how can I optimize them to increase conversions?”.
8. Conversion Rate
It’s not enough to just know the number of conversions on your webpage or application. The Conversion Rate (CR) is another important metric that can provide valuable insights into the performance of your marketing campaigns and help identify the most effective channels.
In GA4, there are two types of conversion rates: User Conversion Rate and Session Conversion Rate. The User CR represents the percentage of converted users, while the Session CR represents the percentage of sessions in which a conversion event occurred. It’s common for the User CR to be higher than the Session CR in your reports.
This metric is especially critical for eCommerce stores, as it serves as a foundation for your marketing efforts.
An objective question to ask when analyzing your conversion rates is “Which traffic sources are performing the best for your business?”.
9. Lifetime Value
The Lifetime Value metric in GA4 allows you to assess the overall value of your users to your business over time. This metric can be used in conjunction with acquisition sources to determine the most effective allocation of your marketing resources in attracting those users.
Analyzing Lifetime Value can also help you identify the acquisition methods that are most effective at bringing in high-value users. In addition, it can provide insights into how much money you should invest to acquire new users.
An important question to consider here is: “What is the Lifetime Value of my users based on their overall performance?”.
10. Total Revenue
The GA4 Revenue metric displays the total amount of revenue generated from purchases, subscriptions, and advertising.
This metric is crucial in evaluating your business’s performance and measuring it against your goals. By analyzing these numbers, you can monitor sales trends and make necessary adjustments to improve performance.
Furthermore, tracking revenue over time can help identify opportunities for growth and inform strategies for increasing revenue.
When analyzing your total revenue, ask yourself this question: “What other strategies can be implemented to increase revenue?”.
11. User Acquisition metrics
These metrics show the sources from which your website or app users are arriving, such as organic search, paid search, social media, or referral traffic. User acquisition is one of the most important metrics in Google Analytics 4 (GA4) because it helps you understand where your website or app users are coming from.
By analyzing it, you can determine which marketing channels are driving the most traffic to your site or app and adjust your marketing strategy accordingly. Here are a few reasons why it is so important:
- Optimize your marketing spend: by knowing which channels are driving the most traffic to your website or app, you can focus your marketing spend on the most effective channels and optimize your budget for maximum ROI.
- Improve user experience: understanding how users are finding your website or app can help you improve the user experience. For example, if you find that users coming from social media channels are leaving your website quickly, you may need to adjust your messaging or user flow to better meet their needs.
- Measure the effectiveness of campaigns: tracking user acquisition helps you measure the success of your marketing campaigns. By comparing the number of users acquired from different campaigns or channels, you can identify which campaigns are generating the most valuable traffic.
- Identify opportunities for growth: analyzing user acquisition can help you identify new opportunities for growth. For example, if you notice that a certain marketing channel is driving a significant amount of traffic to your website or app, you may want to invest more resources in that channel to further increase your user base.
A crucial question you need to ask yourself here is “Which channel is the most profitable?”. Once you know the answer, you can invest more money in it. The next question you should ask is “Why is this channel more profitable than the others?”.
12. Advertiser Ads Clicks
If you are running ad campaigns, the GA4 Advertiser Ads Clicks metric is essential as it shows the total number of times users clicked on your ad. This metric is available in your reports if you have linked your GA4 to your Google Ads account.
By analyzing it, you can determine whether your campaigns are generating enough clicks and adjust them accordingly to achieve better results.
A strategic question to ask here is “How can I increase the number of clicks on my ads?”.
The takeaway
GA4 is a robust tool that enables you to create custom metrics to better understand your website’s performance. You can analyze your data from various angles by creating comparisons and segments.
The combination of standard and custom metrics, along with AI-powered predictions, can help you gain deeper insights into your customers and enhance your marketing strategies.
When it comes to analyzing your business’s performance, it is essential to identify the key metrics for your reports. Each business has unique aspects and KPIs that should be considered when selecting metrics for analysis. Each one of them should reflect a specific business objective.
Keep monitoring your metrics and work hard to improve them!
