“If you know the enemy and know yourself, you will not fear the outcome of a hundred battles. If you know yourself but don’t know the enemy, for every victory gained you will also suffer a defeat. If you know neither the enemy nor yourself, you will surrender in every battle.”
The above quote is from the book “The Art of War” by Sun Tzu, and I know (from my experience) that it applies just perfectly to sponsored links campaigns in Google Ads.
Every day advertisers face a battle with their competitors and fight for a better position on search engine results pages (Google, Bing, among others). Every advertiser does their best to write good ads that stand out so that the CTR (the clickthrough rate, i.e. the number of clicks your ad receives in relation to the number of times it is displayed) increases so your CPC (cost per click) may decrease.
In this tutorial you will learn one of the first steps to start gaining a competitive edge over your competitors in Google Ads. Knowing more about who competes with you means knowing yourself better (understanding what your current position is) and also knowing and understanding your enemy better on the digital battlefield.
Follow the steps below to see who your main competitors are and learn what to do once they have been identified.
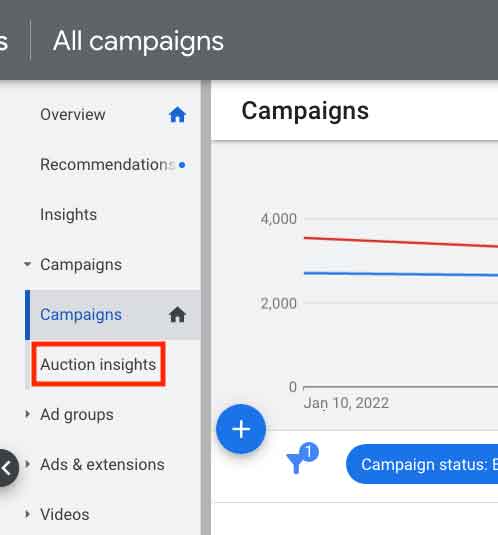
1. In Google Ads, go to “All campaigns” or click on a specific campaign. Then click “Auction Insights” from the menu on the left.
Important: This report is available at the account, campaign, ad group, and keyword levels.
View the report at the ad group level
Enter a campaign, click on an ad group within that campaign and click the same “Auction Insights” link on the left.
View the report at the keyword level
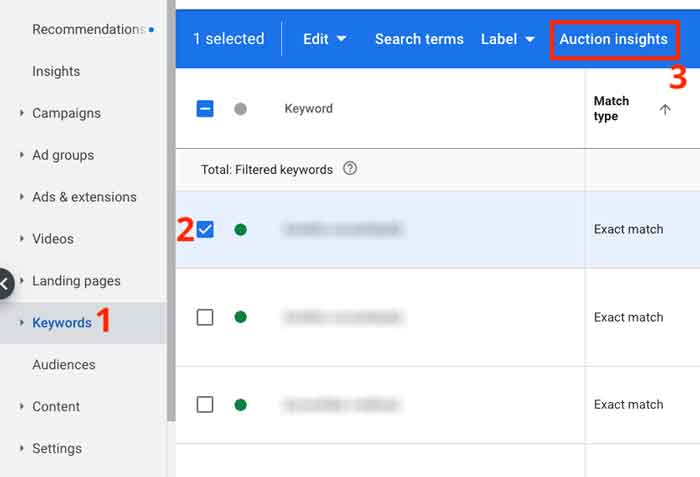
Enter a campaign and click “Keywords” on the menu (1). Then select the keyword for which you want to see the report by checking the box to the left (2). Once selected, the blue bar at the top will show the option “Auction Insights” (3). Just click to see the report.
2. See the report for your main competitors
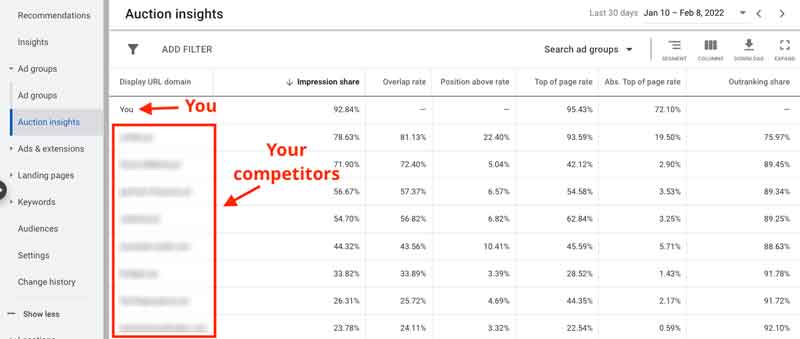
No matter which level you are at (campaign, ad group, or keyword), you will be taken to a data report (like the one below) where you can see your position against your competitors – with metrics. This report allows you to compare your performance with other advertisers. This information is very important because it helps your business make better decisions about bidding, budgeting, and other areas. Knowing exactly where you are performing well and where you are losing ground is essential to making improvements to your campaigns.
Your company is the “You” in the first or last row (depending on how you sort the list).
3. Understanding the columns

In addition to the first column “Display URL Domain”, where the competitors’ websites are, there are 6 other columns in this report:
1. Impression share
This is the percentage of times your ads appear in Google searches.
2. Overlap rate
This is how often another advertiser’s ads were shown in the same auction (in the same search) where your ad was also shown. It is the number of times your ads and those of the competitor were shown together.
3. Position above rate (search campaigns only)
This is how often another advertiser’s ad shows in a higher position than yours in the same auction, when both of your ads were shown simultaneously.
4. Top of page rate (search campaigns only)
This is how often your ad (or a competitor’s ad, depending on which row you’re looking at) was shown at the top of the page, above the unpaid (organic) results.
5. Absolute top of page rate (search campaigns only)
This is how often your ad (or another advertiser’s ad, depending on which row you’re looking at) appeared at the absolute top of the results page (first position), above the unpaid (organic) results.
6. Outranking share
It’s how often your ads were shown above another advertiser’s ads, and the number of times your ad was shown when your competitor’s was not.
4. Further segment your competitors report
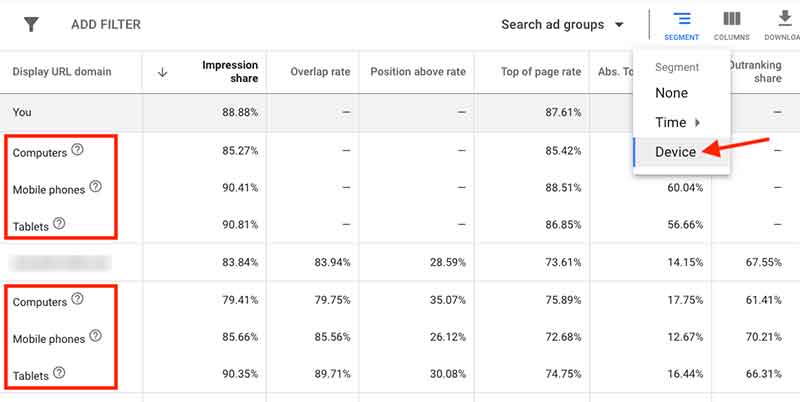
In the Auction Insights report, we also have the option to further segment the data in the columns (which were explained above) by time or by device. Click the “Segment” option on the right side, right above the table:
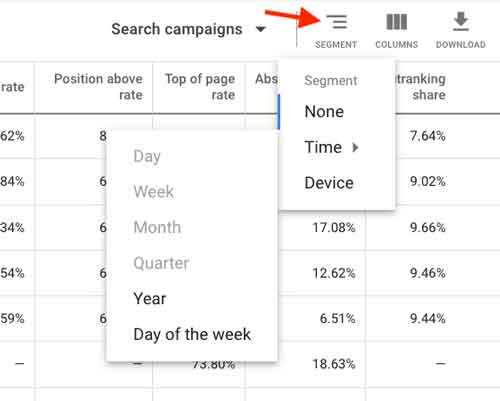
The availability of certain options (segments) will vary depending on the amount of data in the time period you select. In the screenshot above you can see that the options “Day”, “Week”, “Month”, and “Quarter” are not available.
When we select the “Device” option, three rows will appear below each competitor: “Computers”, “Cell phones” and “Tablets”. In each row we can see the data in the respective columns:
How this information can be used
1. See the competition at keyword level
You can see which competitors are spending money on the same keywords as you: just view the Auction Insights report at the keyword level. There’s no better way to analyze your direct competition in Google Ads at the most granular level.
2. Compete on the keywords that carry your competitors’ brand names
Once you have the list of competitors’ domains (which is in the “Display URL Domain” column), you can create a separate campaign with keywords that are variations of their brand names. In most countries, Google allows you to compete on competitors’ branded keywords as long as you don’t use them in your ad text. Make sure Google’s policies in your country allow this practice to avoid legal issues. And in some countries, you can even use their brand names in the ad text.
3. Get an approximate calculation of your competitor’s budget
The Auction Insights report does not provide data on the quality score or bid strategy of competitors because this is private information, but the direction the available numbers point to is always correct and accurate. So, if you know your impression share is 50% and a competitor’s impression share is 75%, using the old simple mathematical Rule of Three will tell you they are spending 50% more than you:
4. Understand your competitor’s strategy at the device level
One of the biggest challenges for companies is understanding the importance mobile traffic has to the purchase decision process, especially in types of business where most transactions are completed offline or online on desktop computers. There is usually a tendency to underestimate or simply forget about mobile and tablet visitors.
We can use device segments in this report to see how your competitor is performing on mobile devices.
In the example below we can see the difference between a competitor’s performance on desktop (desktops and laptops) and on mobile devices. On desktop we competed in 79.75% of the auctions and my ads where shown in a higher position in 61.41% of searches. On mobile, we competed in 85.56% of the auctions, and my ads were shown in a higher position in 70.21% of searches.

Based on findings like the one above, you may decide to increase bids on mobile devices to gain even more visibility, for example.
5. Detect trends over time (your competitors’ and your own)
Your business may have more budget for online advertising at certain times, and this will have a direct impact on your campaigns. There are also times when the same monthly budget produces very different results over the course of a year. There are many other types of possible variations in campaigns, and they happen to us and to our competitors as well. Some of these variations may be the consequence of internal strategic decisions.
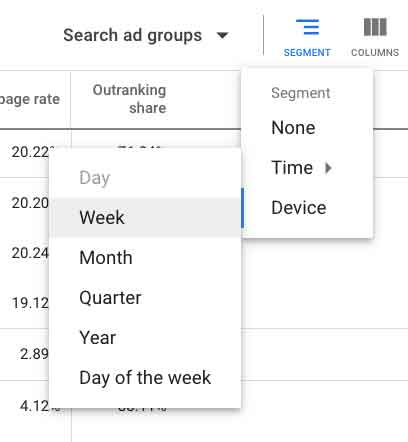
You can use period segments to segregate the table into time.
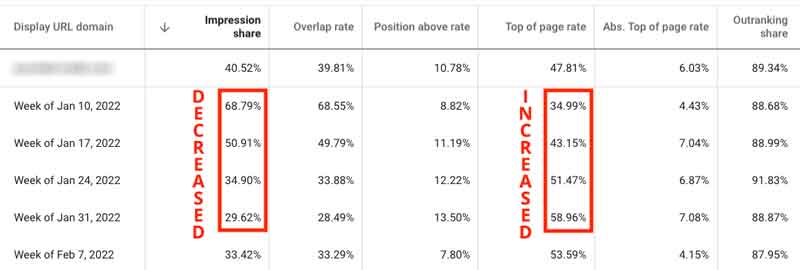
In the example below, we have a competitor that greatly decreased their impression share over the course of 4 weeks (from 68.79% to 29.62%). In the same period, his top of page rate increased a lot. This might have been a case where the competitor preferred to show their ad less frequently (lower impression share) but in higher positions on the results page (higher top of page rate).
6. Visit the competitors’ websites and see what they are doing
Go to their websites to get ideas, many ideas. Are your competitors doing something you should also do? Is there anything interesting on their landing pages? Their layout (headers, footers, menus, etc.)? What are the websites’ conversion points? These are some of the questions you should have in mind when browsing their pages.
Do your own analyses
Each competitive scenario has its peculiarities. Use the information in this post and adapt it to your context, by using combinations of the possibilities you learned, expanding on them, and further improving your report. Get to know yourself and your opponents better!

