There’s no point in running Google Ads campaigns (or on any other ad platform, in fact) if you don’t measure and analyze your results. This is where reports come in. They show your campaign’s metrics and dimensions. They show specific aspects – chosen by you – that will help you make better decisions for the future of your campaigns and your business. In this tutorial, you will learn how to create custom reports in Google Ads so you can have an x-ray view of your campaigns’ performance – and make smarter choices.
What are Google Ads reports?
Google Ads Ads reports are performance metrics and dimensions that measure the success of your ad campaigns, displayed as tables, graphs or charts. Reports can tell you everything – from the number of people who clicked your ad to the geographic location of that audience.
These metrics provide insight into what is doing well and what is not doing so well in your campaigns. Monitoring them from time to time can also help you spot more serious issues.
For example:
- if you’re not reaching the right kind of audience;
- if you’re not able to get conversions from those you’re reaching;
- if you’re simply not reaching enough people;
your reports will be critical to detecting these flaws.
Reports display metrics against dimensions. But what is the difference between them?
Metrics are quantitative measures of data and dimensions are labels used to describe them. In simpler terms: metrics are always shown as numbers (numeric values, percentages, currencies, etc.) and dimensions are almost always shown as non-numeric values (day of week, month, city, browser, device, etc.). I said “almost always” because there are a few dimensions that are expressed by numbers – such as “time of day” – because they represent a “phase of the day” – a qualitative aspect that happens to be expressed by hours (which, in turn, are expressed by numbers).
Let’s look at an explanatory table:
| Dimension | Dimension | Metric | Metric |
|---|---|---|---|
| Month | Device | Clicks | Conversions |
| January | Smartphone | 2.000 | 150 |
| February | Smartphone | 3.500 | 240 |
Where can we find reports in Google Ads?
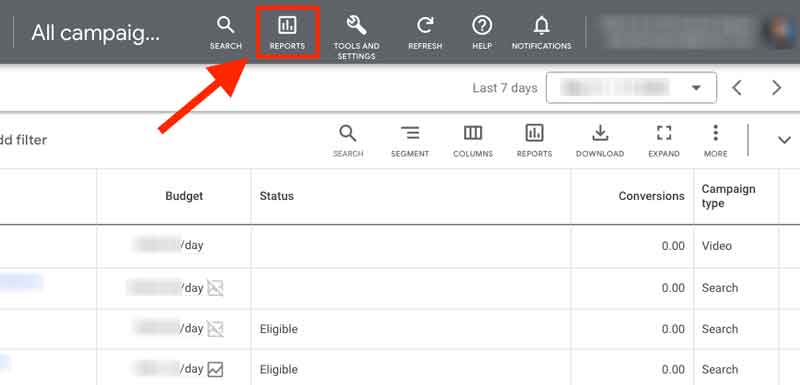
The “Reports” option on the top menu
To access the reports section, choose “Reports” from the top menu.
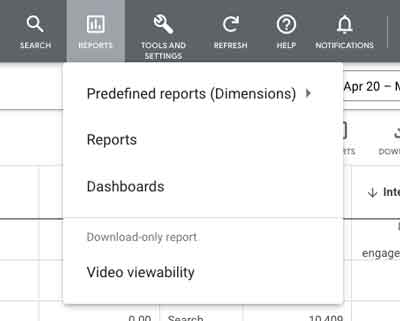
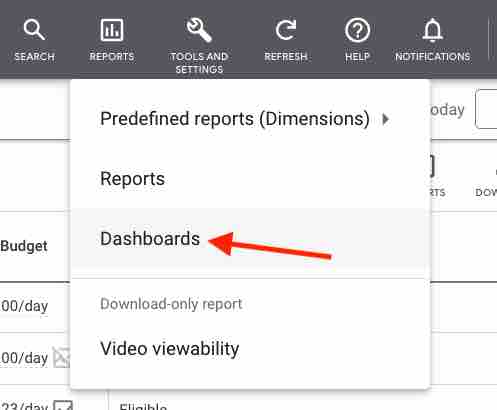
When you click “Reports”, the sub-items “Predefined reports (dimensions)”, “Reports” and “Dashboards” will show up.
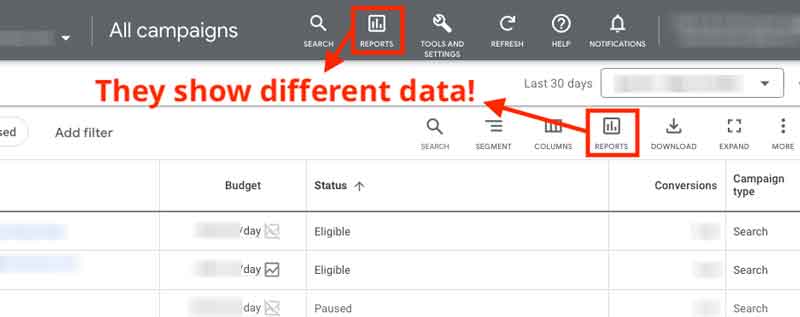
The “Reports” option just above the statistics table within campaigns or ad groups
If you are viewing data at a campaign or ad group level, you will see that a second “Reports” button appears just above the metrics table:
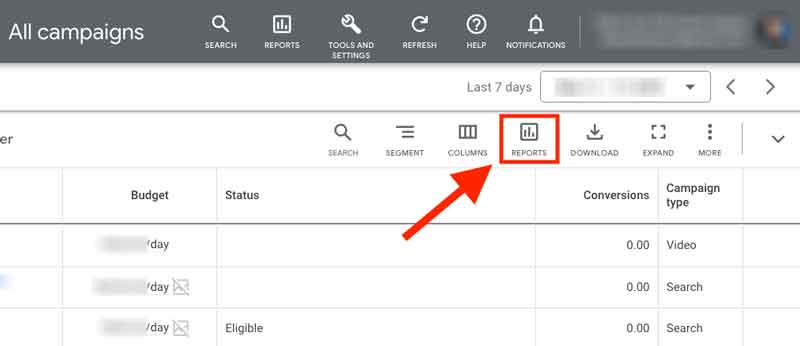
This option shows data only for the campaign or ad group you are currently in. The other option “Reports” on the top menu shows data at the account level at first.
Options under “Reports” from the top menu
“Predefined reports (Dimensions)” option
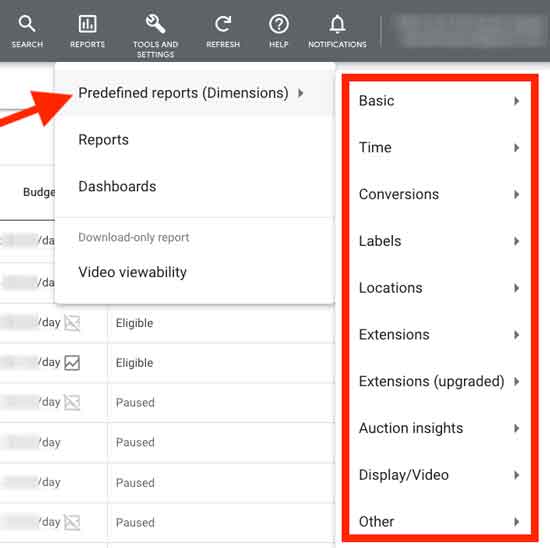
The predefined reports are ready-made reports with useful data, such as statistics for locations and days of the week. Just choose one and you will jump to the report screen.
Under each one of the options, there are several ready-made reports. For example, under the “Basics” option you’ll see:
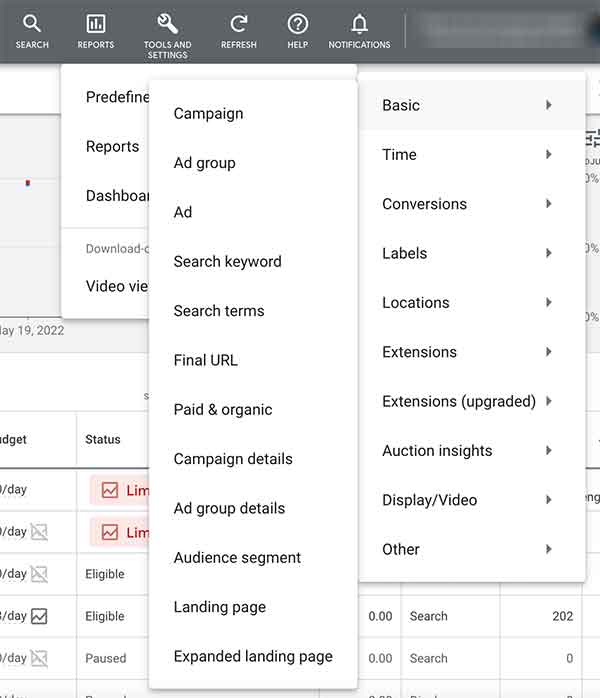
Don’t forget!
When the option “Predefined reports (Dimensions)” is chosen, you will see data at the account level (general, for all campaigns). But if you filter your view to a specific campaign or ad group, then the report will show only data related to that campaign or ad group.
If you have a Google Ads manager account (an MCC), every predefined report you open will include the additional “Account” and “Customer ID” columns.
“Reports” option (where you can create your own custom reports)
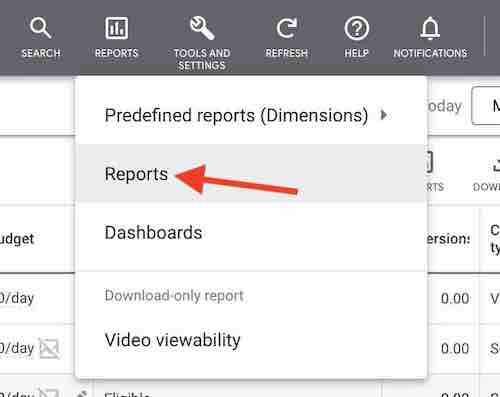
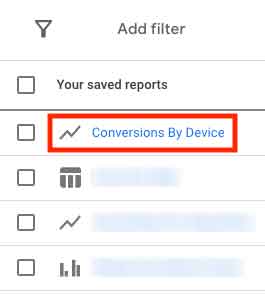
When you choose this option, you are taken to a screen where there are a few predefined reports and the “+ Custom” button, which opens the Report Editor, where you can create your own custom reports manually. The reports you create and save will be listed in the “Your saved reports” section.
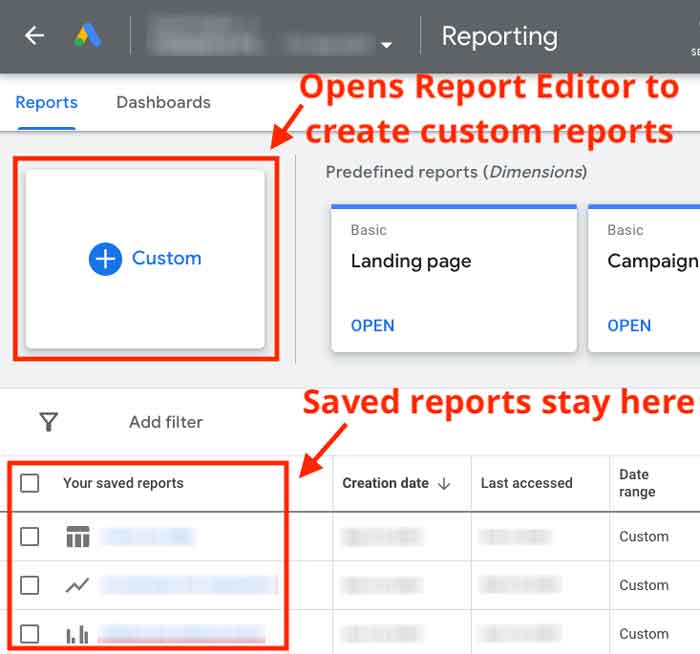
When you click the “+ Custom” button, the view options (chart type options) for the report you are creating will show up:
- Table;
- Line chart;
- Column chart;
- Grouped column chart;
- Stacked column chart;
- Bar chart;
- Grouped bar chart;
- Stacked bar chart;
- Scatter chart;
- Bubble chart;
- Pie chart.

After choosing a chart type you will be taken to the Report Editor.
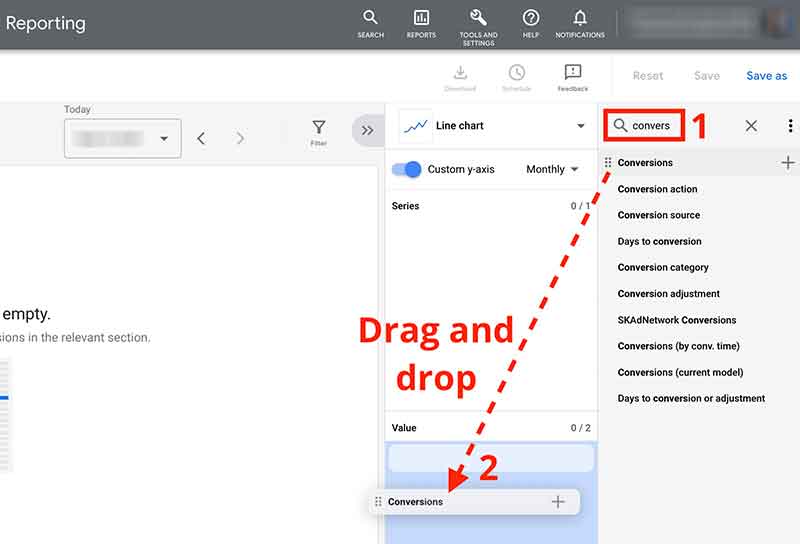
There is a search field (1) to find the dimensions and metrics you want. When choosing a dimension or a metric, just click and drag it to the “Series” field or to the “Value” field (2). In the example below, we are going to create a report named “Conversions By Device”.
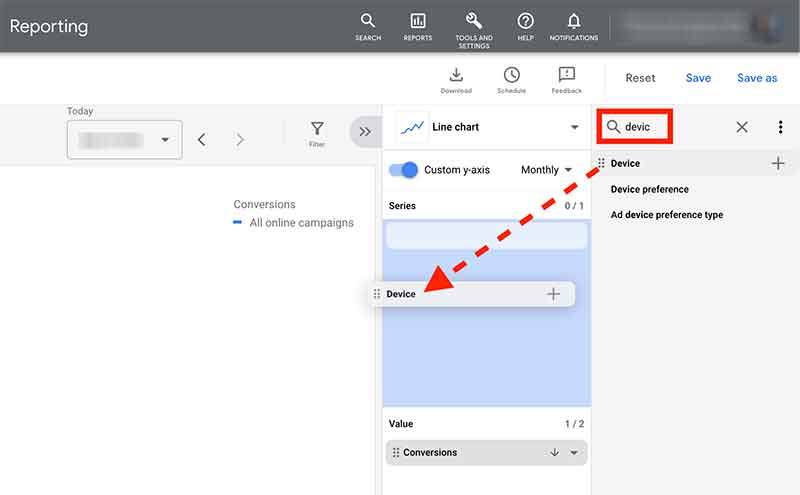
After choosing the “Conversions” metric and the “Device” dimension, we got a graph showing the conversions broken down by device type (mobile, tablet, and desktop/laptop). Just choose the desired time period to view the data.
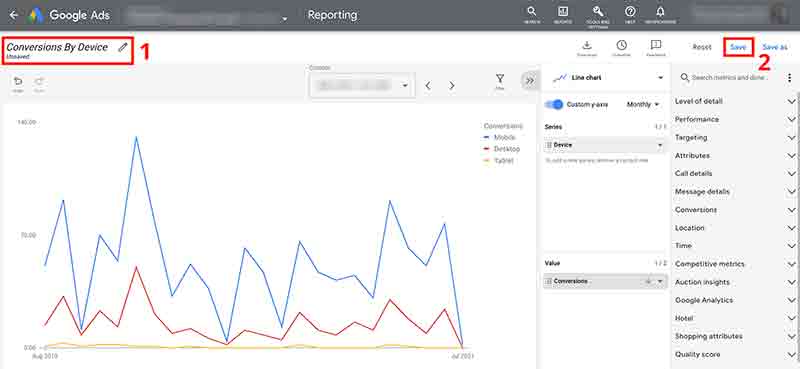
Don’t forget to name your report (step 1 in the screenshot above) and save it (step 2 in the screenshot above) so that it stays in the “Your saved reports” list (at the beginning of the “Reports” section). That will allow you to view it again later with just one click.
“Dashboards” option
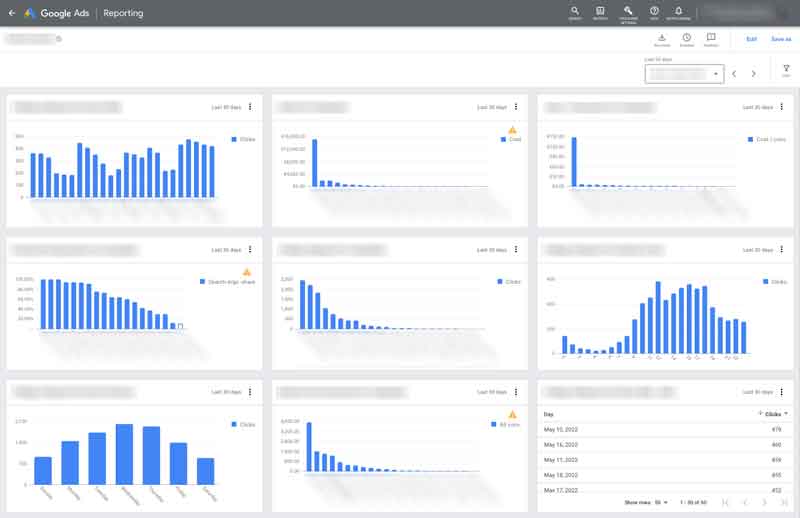
Dashboards are customizable, visual summaries that show how your campaigns are performing. The data is shown as graphs , tables , text notes or overviews in a grid of cards. You can place the cards in any square of the grid.
Graphs and tables
These are the reports created in the Report Editor (as I explained above).
Overviews
Overviews show the performance of basic metrics.
Notes
Notes allow us to add text with more information about the context of the dashboard so that others who have access to it (or yourself) can understand it better. Basically, they are contextual explanations.
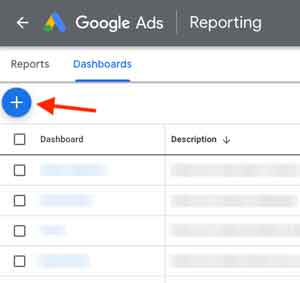
To create a dashboard, go to “Reports” on the top menu and choose the option “Dashboard”. Once inside the section, click the blue “+” button.
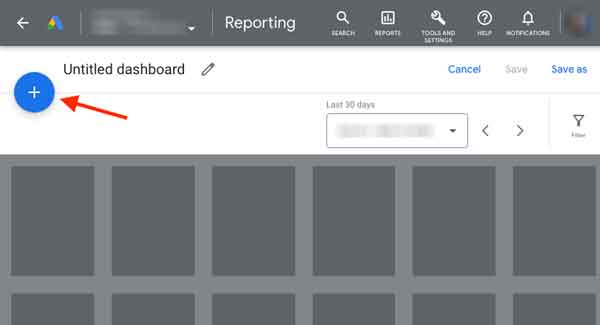
On the next screen, you’ll see the cards, but they will still be empty. To add a new card with data, click the blue “+” button again.
Then choose the type of card you want to insert: note (text note), report, or scorecard.
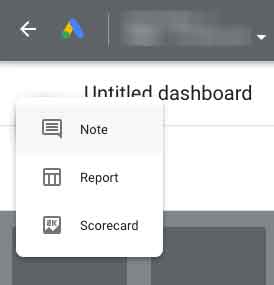
Then, just follow the steps (they’re self-explanatory) and repeat the procedure for the other cards. Don’t forget to name your dashboard and save it at the end by clicking the “Save” option at the top right-hand corner (otherwise your work will be lost). When you enter the name, there will also be an option to add a description for your dashboard.
What metrics should you focus on in your reports?
There are hundreds of report types, and choosing which ones you should use depends on what analysis you want to do. For example, a very basic and standard report would be “Clicks vs. Impressions”.
General cost reports for specific periods of time are also very frequent. For example, “Cost per campaign in the last 7 days” or “Cost per keyword in the last month” are usually the first step of deeper, longer analyses.
Keep in mind that in most cases you will need to view several reports in order to have a real overview of your account’s performance.
However, there are two types of reports I believe are the most important to measure the performance of a campaign, ad group, or keyword:
- the Conversion Rate report;
- the Cost Per Conversion report.
The reason for their great importance is simple: in most cases, they will tell you if your campaigns have had good results or not. But in order to interpret these reports, one must understand the concept of “conversion”.
A conversion is any action you want your site visitors to take while they are visiting your site. Common conversion actions are:
- the purchase of one of your products or services;
- add a product to the cart (e-commerce);
- download an e-book;
- subscribe to your newsletter (join your mail list);
- make a reservation or quote;
- run a price simulation (e.g. car insurance quote, loan quote, etc.);
- view a specific page on your website;
- view a video.
In addition to the actions I mentioned above, several others can be considered as a conversion. This decision (on which actions on the site will be considered a conversion) depends on the site owner’s objective – and therefore the business’s objective as a whole.
If you haven’t set up conversions in your Google Ads account yet, you’re literally in the dark (with very few exceptions). To get started with setting them up, read the Google Ads documentation here , learn the basics, and see how to implement it.
Besides the Conversion Rate and Cost Per Conversion reports, you should also dig deeper into your conversion scenario with the following reports:
- Conversions by time of the day;
- Conversions by day of the week;
- Conversions by day (of the month);
- Conversions by location;
- Conversions by device (desktop, tablet or mobile).
The reporting suggestions above are based on years of work with many clients across multiple industries. I know for a fact that companies need them all the time, but choosing the right report (or reports) depends on what you need to see at that very moment. There are many types for many different needs. That’s always very important: knowing exactly what you need!

